
TL;DR
- Five new roles this week, from Managing Director of Corp Dev at GardaWorld to Head of Business and Corp Dev at Phantom.
- Anthropic’s S-1 is public: $16.3B in H1 revenue, its first operating profit, and an $80.7B net loss that’s mostly non-cash.
- Global M&A reached $4.44T through Q3, the second-best nine months on record after 2021, but Q3 slowed sharply as megadeals dried up.
All content is written by me, with research pulled from online sources and AI. Sources are listed where possible. Some sections include photos and graphs generated to complement the articles.
This Week's Roles
This week's hand-picked roles across Corporate Development, Corporate Strategy, and Buyside M&A:
Managing Director, Corporate Development
GardaWorld
Runs the full M&A agenda at the Canadian security giant: 5-15 local and international deals a year plus related financing, leading a 6-9 person team from analyst to VP. Reports to the SVP of Corp Dev; 15+ years of experience and French/English fluency required.
Corporate Development Manager
Iterative Health
Full-cycle M&A seat on a clinical-research roll-up of 100+ sites, covering sourcing, diligence, execution and integration. Reports to the VP of Corp Dev, with direct exposure to the exec team on a growing function.
Senior Associate, Corporate Development
Ohr
Help build an acquisition engine from scratch at a defense-chemicals company buying licensed manufacturing sites and qualified production lines. Reports to the Director of Strategic Initiatives; expect 40-60% travel, and ITAR rules apply (US persons only).
Director, Corporate Development & Strategic Finance
Earth Force
Works directly with the CEO and Board at a wildfire-tech company working with the US Forest Service. Leans toward capital formation and strategic finance alongside corp dev, a good fit for someone who wants fundraising and M&A in one seat.
Head of Business and Corporate Development
Phantom
Leads partnerships, strategic intelligence and M&A at the a16z- and Sequoia-backed crypto wallet, owning deals end to end from sourcing to integration. Built for a 10+ year operator with a real network in Solana and fintech.
Anthropic’s S-1 Filing: A Review
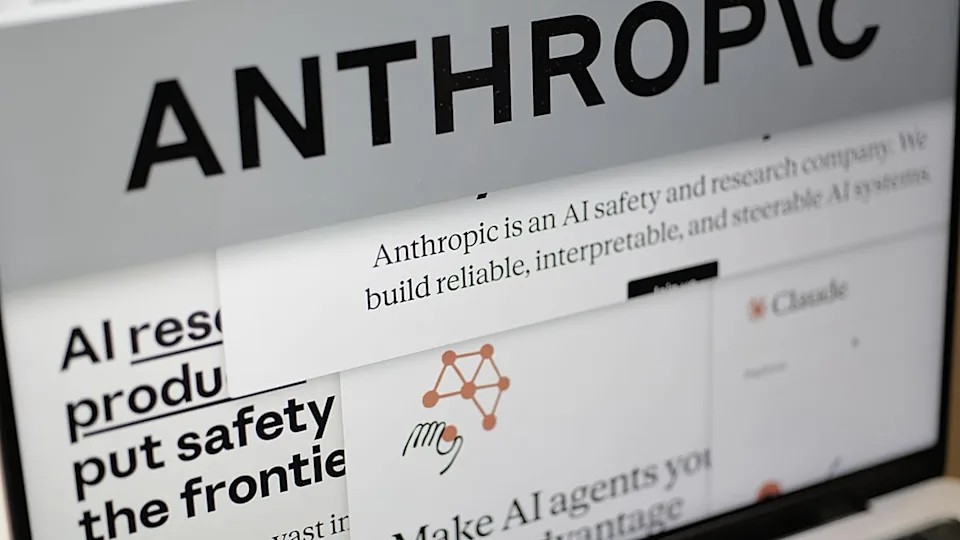
On October 26, we got a look at Anthropic’s public S-1 filing for the first time. The company has applied to list Class A shares on the Nasdaq Global Select Market under ticker “ANT”. For the time being, we still don’t know the price range, share count, or raise size. Goldman Sachs and Morgan Stanley are leading the underwriting syndicate, composed of roughly 30 banks.
Revenue
Anthropic booked $16.3 billion of revenue in H1 2026, up from $1.16 billion in the same period last year. Full year revenue has increased from $41 million in 2023, to $386 million in 2024, and $4.6 billion in 2025. Q2 of 2026 was by far the largest quarter in the filing, coming in at $11.6 billion, up roughly 147% from $4.7 billion in Q1. Q3 results aren’t out yet, but Anthropic reportedly told investors on October 14 that Q3 revenue reached $16.8 billion, up from Q2 but with a less dramatic growth rate.
About 80% of H1 revenue ($13.1 billion) was consumption-based, meaning customers pay for what they use, mostly through the API. The remaining $3.2 billion came from subscriptions.
Profitability
Q2 2026 produced $974 million of operating income, an 8% operating margin and the first operating profit in any period the filing covers. For the full half, the operating loss was $693 million, versus $2.1 billion a year earlier. The largest cost line was compute and infrastructure, at $8.9 billion, or 55% of revenue.
Overall, there was an $80.7 billion net loss, primarily non-operational in nature. The vast majority came from non-cash convertible note adjustments, which amounted to $72.4 billion. As Anthropic’s private valuation surged, the fair value of its outstanding convertible notes and SAFEs increased, which the company was required to record as a paper loss. Another $8.8 billion came from fair-value changes tied to note purchase agreements with Google and Amazon.
Balance Sheet
Anthropic had raised $141.1 billion as of June 30. At that date, it held $112.4 billion in cash, plus $19.3 billion in short-term investments. Headcount is about 5,300 as of September 30, up from 940 in December of 2024.
Valuation
The S-1 leaves the price range blank, but some investors who attended Anthropic’s investor day in San Francisco on October 14 were reportedly discussing a $1.5 trillion price tag, per Reuters. That figure is down from the roughly $2 trillion expected before the Q3 numbers showed growth slowing. For reference, Anthropic’s last private round in May was priced at $965 billion.
At $1.5 trillion, the company would be valued at approximately 22 times annualized Q3 revenue, versus more than 300 times its actual 2025 revenue. The gap illustrates both the speed of Anthropic’s growth and how much of the price rests on growth that hasn’t happened yet.
Why This Matters for M&A Professionals
SpaceX’s S-1 in May gave the market its first look at frontier-lab economics, through xAI as a segment. Anthropic’s filing is the first full set of standalone financials from a pure-play lab. This market moves fast and the read on these numbers will shift, but with OpenAI expected to follow, they’re likely to become the reference point for AI valuations and the deals that follow. This filing also raises the question: how much of today’s growth and margins can be sustained as competition increases, model pricing evolves, and the cost of compute continues to shape the economics?
Sources: Anthropic, PBC Form S-1 (Oct 2026); Financial Times (Oct 2026); Reuters (Oct 2026)
Near-Record Year: The Q3 M&A Check-In

Mergermarket’s 9M26 report on the first three quarters of 2026 came out, and a few things stood out: global deal volume rose 27% year-over-year to $4.44 trillion across 32,419 deals, making it the second strongest first nine months on record, after the $4.55 trillion peak in 2021. Deal count declined 1% over the same period. The point isn’t a decline, it’s how count essentially stayed flat while value rose considerably. (A note on the numbers: data providers count deals differently. LSEG puts 9M volume at $3.9 trillion and Dealogic at $3.2 trillion, versus Mergermarket’s $4.44 trillion. The direction is the same across all three, but the totals aren’t comparable.)
The Year Was Front-Loaded
More than 72% of total deal volume came in the first half, and June alone set a single-month record at $678.1 billion. Q3 was comparatively cool. LSEG data shows third-quarter dealmaking down 41% from the previous quarter, dipping below the $1 trillion mark, while mega deals (valued over $10 billion) dropped from 26 in the second quarter to just 10 in the third.
A Handful of Deals Carried the Market
Megadeals accounted for a record 35% of global volume, reaching $1.54 trillion across 60 transactions. PwC’s mid-year review used a lower $5 billion threshold and found those deals account for nearly half of global value. Strip them out and, by PwC’s count, deal value is down 4% year-over-year. In other words, without the largest deals, the market would be shrinking.
Corporates Were Doing the Buying
Sponsors spent most of the year selling. Mergermarket puts sponsor investment down 11% to $584.2 billion in the first nine months of 2026, while exits rose 12% to $605.3 billion. Strategic buyers carried the market, accounting for 76% of global deal volume in the first half. Truist Securities, working from Dealogic data, says corporates kept prioritizing long-term strategic moves despite the macro backdrop, though it also notes PE-led and mid-sized deals made up ground in Q3.
Tech Kept the Lead
The tech sector recorded a total $1.1 trillion in deal volume across 7,987 deals in the first nine months of 2026, a 36% rise compared to the same period in 2025, with four of the top 10 deals involving tech targets. That makes eleven straight quarters at the top.
Looking ahead to Q4, Mergermarket’s Lucinda Guthrie noted that processes kept coming to market after the August slowdown. Her open question is whether uncertainty over growth, geopolitics, and financing will stop those deals from closing.
Why This Matters for M&A Professionals
The broader picture is one we’ve discussed for a number of months now. The M&A market looks exceptionally strong in aggregate, but considerably less so beneath the surface. Large strategic transactions have propelled announced deal value toward record levels, but most of us aren’t feeling the effects. For corporate development teams outside the megadeal market, the headline figures may overstate how strong conditions really are.
Sources: Mergermarket / ION Analytics 9M26 and 1H26 M&A Highlights (Jul, Oct 2026); LSEG Data & Analytics via Investment Executive (Oct 2026); Truist Securities Q3 2026 M&A Outlook (Dealogic data); PwC Global M&A Trends Mid-Year Review (2026)
Thank You
Thanks for the support — it means a lot. Consider sharing with your network, or providing feedback here: corpdevcareers.com/contact
— Liam